16 July 2025

Increased risk profile of KiwiSaver funds 2021-2024

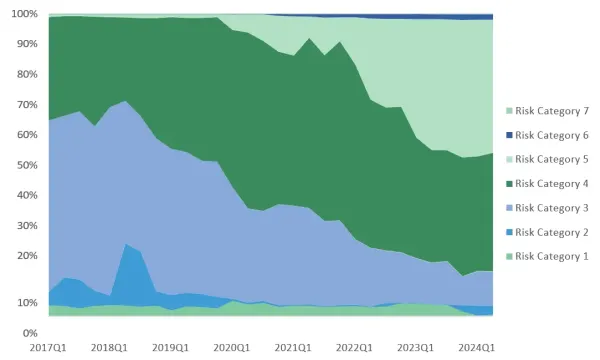
We have observed a dramatic increase in the overall risk categorisation of KiwiSaver funds in recent years. The proportion of KiwiSaver invested in risk category 5 funds (high volatility) has quadrupled from around 10% in 2021 to more than 40% in 2024, with the proportion in risk category 3 funds (low to medium volatility) decreasing from 30% to 10% over the same period.

This paper describes the observed increase and discusses potential drivers, including changes to policy settings, investor behaviour, and market volatility. It appears that the observed increase reflects a combination of these factors. Regardless of cause, KiwiSaver has become notably weighted towards higher-risk funds over time. 

Download the Increased risk profile of KiwiSaver funds 2021-2024 [PDF 442KB]


Disclosing the risk and volatility of managed funds

Managers and supervisors of managed funds are required to disclose risks associated with each fund in clear and consistent terms, by presenting a risk indicator, as set out in Table 1 below.

This risk indicator is intended to enable comparison of volatility between various products, helping investors make informed decisions. It is based on 2010 guidelines produced by the Committee of European Securities Regulators (CESR1) for the calculation of a ‘synthetic risk and reward indicator’ for key disclosure documents. The risk indicator presents categories that represent the annualised volatility of weekly returns over the previous five-year period. 2,3

Table 1: Risk categories and definitions4

Risk category

Annualised standard deviation

Description of volatility

1

Less than 0.5%

very low

2

0.5% or more, but less than 2%

low

3

2% or more, but less than 5%

low to medium

4

5% or more, but less than 10%

medium to high

5

10% or more, but less than 15%

high

6

15% or more, but less than 25%

very high

7

25% or more

extremely high

We have observed an increase in the risk rating of KiwiSaver funds, particularly from 2021 onwards

As shown in Figure 1, the proportion of KiwiSaver invested in risk category 5 funds (high volatility) quadrupled from around 10% in 2021 to more than 40% in 2024, with the proportion in risk category 3 funds (low to medium volatility) decreasing from 30% to 10% in the same period.


Figure 1: Proportion of KiwiSaver balance by risk category (2017 to 2024)

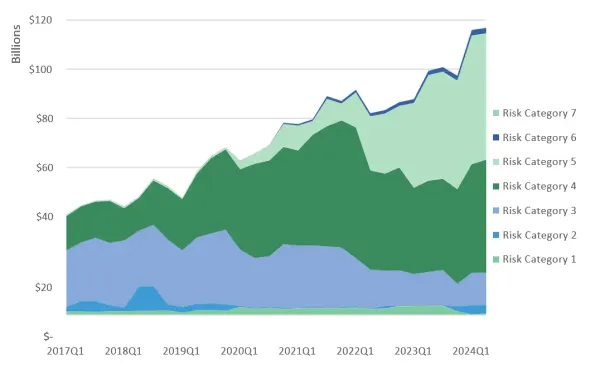
This change occurs in the context of ongoing growth in the value of KiwiSaver. Figure 2 illustrates the balance held at each risk category over time. As of 30 June 2024, $51.5 billion was invested in risk category 5 funds, up from $6.8 billion in 2021.

Figure 2: Value of KiwiSaver balance by risk category (2017-2024)

After a 2021 policy change, default KiwiSaver accounts are now allocated to balanced, rather than conservative, funds

Part of the shift is explained by a policy change at the end of 2021. Prior to this, default KiwiSaver accounts5 were automatically allocated to conservative funds (typically rated as risk category 3 – low to medium risk). Since 2021, default accounts are placed into balanced funds (typically rated as risk category 4 – medium to high risk).

However, the observed shift is larger and more enduring than can be explained by this change in default fund allocation. The value of default KiwiSaver funds as of 31 March 2024 was just $3.4 billion, roughly 7% of the value of risk category 5 funds.

Past performance of investment assets may have influenced investor perceptions of risk

In the period prior to the COVID-19 global pandemic, interest rates were historically low6, and inflation was low and stable. As a result, many fixed-income assets provided low returns. On the other hand, stock markets have performed very well in most years since 2017, and the few periods of weakness quickly reversed.

The strong performance and relative stability of stock markets may have therefore made higher-risk investments more attractive to investors. The persistence of this situation over several years may have contributed to the observed shift in preference for higher-risk investments, illustrating adaptive expectations among investors.

KiwiSaver switching data supports this hypothesis of active investor choice: since 2017, more KiwiSaver members have switched into growth funds7.

Increasing risk preference can also be seen in other markets facing similar economic conditions. For example, Bloomberg reflected that “the theme of lower quality, higher yielding fixed income assets outperforming broader investment-grade assets continued in 2024 marking the fourth consecutive year of this trend”8.

Further, the return of inflation from 20219 may have exacerbated the search for return through higher-risk investment. In 2022, Mary Holm, a New Zealand journalist who offers personal finance guidance, advised investors to switch to higher-risk assets if they were concerned about high inflation reducing the real (buying power) value of their funds10.

Periods of market volatility, such as the COVID-19 pandemic, have a direct effect on risk calculation for managed funds

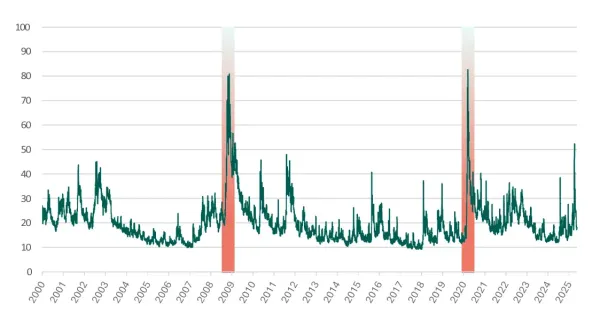
Because the risk category of each fund is determined on the basis of its volatility over the last five years, the period of market volatility surrounding the COVID-19 global pandemic continues to impact the risk calculation of funds up until mid-2025. The VIX Volatility Index (Figure 3), illustrates this spike in volatility in early to mid- 2020.

Figure 3: VIX Volatility index 2000-2025, highlighting Global Financial Crisis (January 2008) and COVID-19 pandemic (March 2020)11

While we may therefore expect to see a decrease in the overall risk profile of managed funds as this event drops out of the five-year window, it should be noted that a smaller but notable spike in market volatility occurred in April 2025. In any case, the change in the risk profile of managed funds may well reflect periods of general market volatility, rather than a structural change in fund composition.

The observed increase in reported fund volatility likely reflects a combination of factors

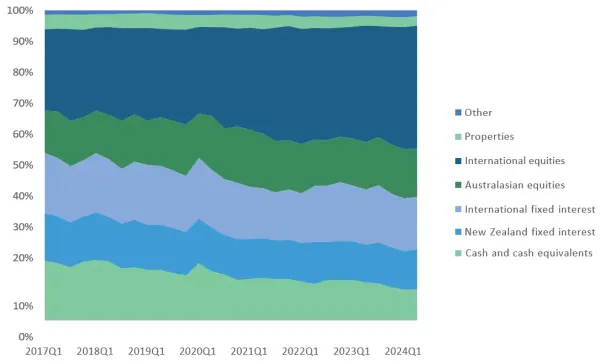
If investor behaviour was the sole driver of the observed change, we would expect to see a pronounced increase in the proportion of KiwiSaver invested in equities, at the expense of cash and fixed interest assets. Figure 4 shows the value of different KiwiSaver investment categories over the period - while there has been a relative increase in the proportion of funds held in international equities, this is gradual and does not follow the same pattern as the proportion of funds held by risk category (Figure 1).

Figure 4: Changes in KiwiSaver investment categories over time

As such, it appears that the observed increase in reported volatility reflects a combination of factors, including policy changes, investor preferences, and market conditions. Regardless of cause, the value of KiwiSaver assets has become notably weighted towards higher-risk funds over time.

Disclamer

This paper has been published by the Financial Markets Authority and is based on analysis of Disclose Register data provided by fund managers. The views, opinions, findings, and conclusion or recommendations expressed in this paper are strictly those of the author(s) and do not necessarily reflect the views of the Financial Markets Authority, its Board or the New Zealand Government. This document should not be used as a substitute for legislation or legal advice. The Financial Markets Authority (FMA) is not responsible for the results of any actions taken on the basis of information in this document, or for any errors or omissions in, or for the correctness of, the information contained in papers and articles.


Related Links

1 CESR was replaced by ESMA (European Securities Markets Authority) in 2011.

CESR/10-673 CESR’s guidelines on the methodology for the calculation of the synthetic risk and reward indicator in the Key Investor Information Document (July 2010) | esma.europa.eu

3 Financial Markets Conduct Regulations 2014 (LI 2014/326) (as at 31 March 2025) Clause 6: How risk indicator is calculated and filled in | legislation.govt.nz

“The indicator must rank the fund on the 1 to 7 scale on the basis of a standard deviation calculated from weekly returns of the fund (or, if weekly returns are not otherwise calculated by the manager, monthly returns of the fund) over the 5 years ending on the most recently completed quarter and annualised.”

4 Guidance note on risk indicators and description of managed funds | fma.govt.nz

5 People who do not choose a KiwiSaver fund when they start work and are not already a KiwiSaver member are automatically enrolled in a ‘default fund’. The Government chooses the providers of default funds. New KiwiSaver default providers | ird.govt.nz; KiwiSaver default funds | mbie.govt.nz

6 The official cash rate | rbnz.govt.nz

7 KiwiSaver Annual Report 2024 p 26 | fma.govt.nz

8 Looking back at 2024: Fixed income | bloomberg.com

9 Inflation | rbnz.govt.nz

10 Your Money with Mary Holm | rnz.co.nz

11 This chart was created using data from VIX Volatility Index Historical Chart | macrotrends.net