02 April 2025

Financial Advice Providers Industry snapshot

This is the first time the FMA has collected a comprehensive snapshot of the financial advice sector since the new Financial Advice regime came into effect in March 2023. This data is derived from the 2024 Financial Advice Provider regulatory returns and provides valuable insights into what types of products are being advised on as well as the way customers are receiving that advice. The FMA will use the data to help shape the way we supervise and engage with the sector going forward.

This industry snapshot has been compiled using the regulatory returns data from 1 July 2023 - 30 June 2024. There were 8,472 financial advisers as at 30 September 2024, compared to 9,300 in 2021. The sector is healthy, the total number of Financial Advisers and Nominated Representatives remains strong throughout the regulatory changes.

Licensed Financial Advice Providers

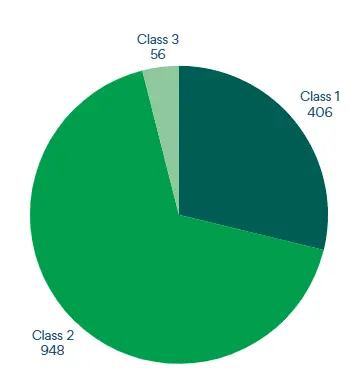
1,410 licensed FAPs submitted a regulatory retune in 2024.  Of the submitters 406 Class 1 providers – these providers work as a sole adviser business or give advice via digital means. There are 948 Class 2 providers which are providers who may engage several advisers providing advice to retail clients and/ or have Authorised Bodies under their licence and/or digital means  There are 56 Class 3 providers who provide regulated financial advice to retail clients via Nominated Representatives and/or Authorised Bodies under their licence and or/ digital means, subject to the limitations in the FMC Act.
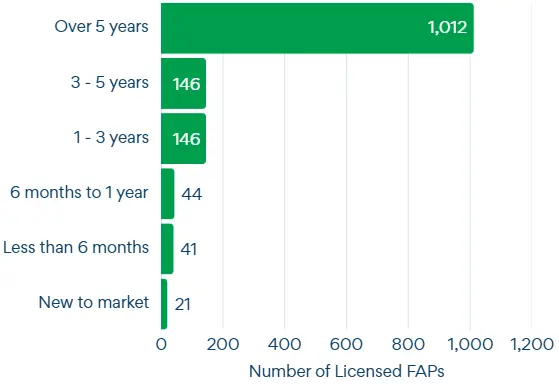
Length of time providing advice in New Zealand

This graph highlights that a significant majority of licensed FAPs have been in the market for over five years, indicating a well-established presence.
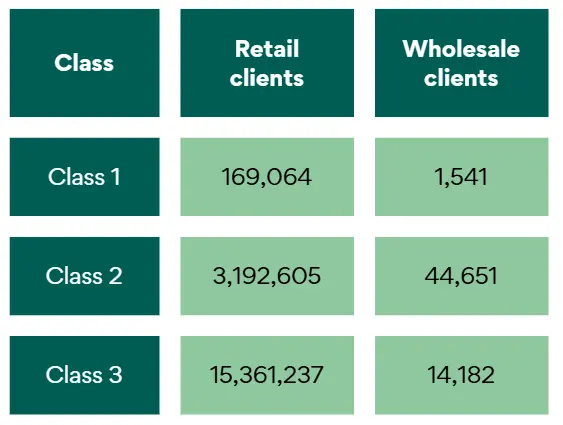
Client type

Class 3 FAPs include New Zealand’s largest banks, who count most customers as financial advice (retail) clients. New Zealanders having relationships with multiple banks is why a large number of retail clients was reported by Class 3 FAPs.

This graph compares the number of retail and wholesale clients across three different classes of FAPs.

Engagement and Authorisation

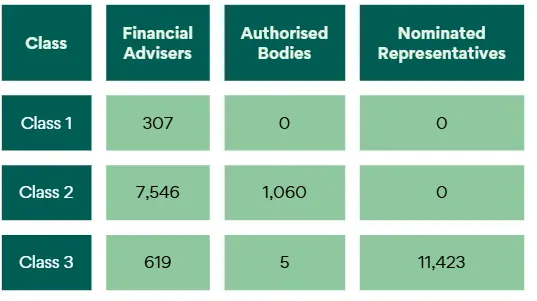
Class 3 FAPs include New Zealand’s largest deposit takers and insurers, who engage majority of their customer-facing teams as Nominated Representatives under their FAP licence.

This graph highlights the distribution of Financial Advisers, Authorised Bodies, and Nominated Representatives across different classes of FAPs.

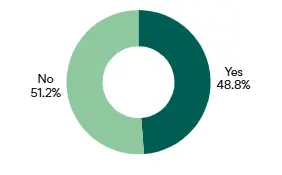
Class 1 FAP with Locum

Class 1 licence holders are permitted to appoint a Financial Adviser as a locum to provide regulated financial advice on the licence holder's behalf if they are unavailable to provide advice for an extended period. This data represents those who have an arrangement in place, if needed. It does not represent FAPs that has activated the locum arrangement.

Notable products and services

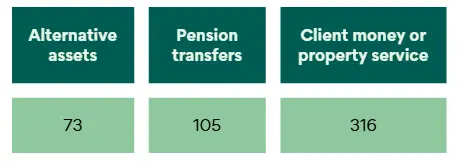
This graph highlights the notable products and services, with "Client money or property service" having the highest count.

Digital Advice

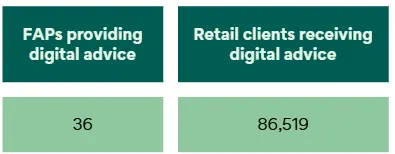
Digital advice activity only includes retail clients that acquired a financial advice product as a result of digital advice received from the FAP.

There are 36 FAPs across the three licence classes providing digital advice and 86,500 retail clients received digital advice. This shows us that less than 3% of licensed providers offered digital financial advice during the return period.

Retail KiwiSaver Provider switches

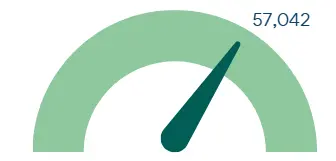
Retail KiwiSaver switches are those who transferred KiwiSaver to a different provider as a result of financial advice.

Over 57,000 KiwiSaver provider switches suggest that New Zealanders are becoming more active by shopping around to find the fund that best addresses their needs.

Our figure is only limited to those who switched to an entirely different provider (not a fund within the same provider) and as a result of financial advice. Readers can view broader switching activity in the KiwiSaver industry in our KiwiSaver Annual report.


Types of regulated financial advice provided

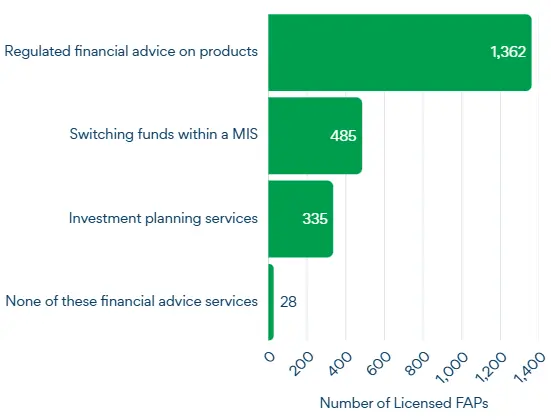
This graph highlights the distribution and prevalence of various financial advice services provided by licensed FAPs, with regulated financial advice on financial advice products being the most common service offered.


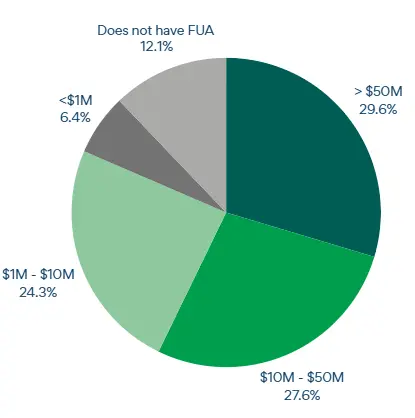
Funds Under Advice (FUA) at the end of the return period

This pie chart shows the distribution of FUA among different categories. It highlights that a significant portion (57.2%) of the funds under advice falls within the higher brackets (greater than $10 million).


Types of products where financial advice was provided

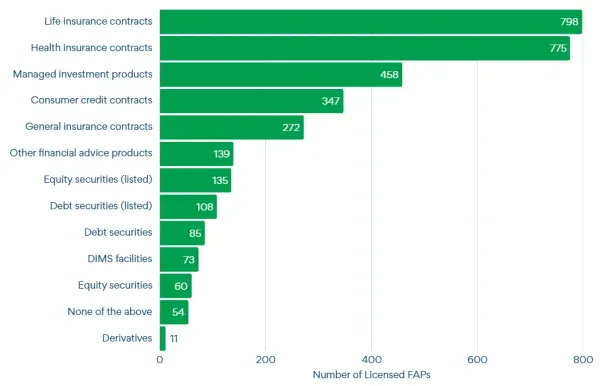
FAPs can select multiple products they give advice on. E.g. several FAPs with Authorised Bodies (ABs) selected Consumer Credit Contracts only once, on behalf of all the ABs and Financial Advisers under their FAP licence. 55 FAPs did not provide any regulated financial advice during the return period.

This graph indicates that life insurance contracts and health insurance contracts are the most common types of products for which financial advice was provided, with both categories having significantly higher numbers compared to others.

This indicates FAPS are giving advice on the most common products that New Zealanders need, such as life insurance health insurance, investments, and consumer credit contracts. Many FAPs provide advice on more than one of these products or have referral arrangements, indicating a holistic service.

Types of marketing and advertising

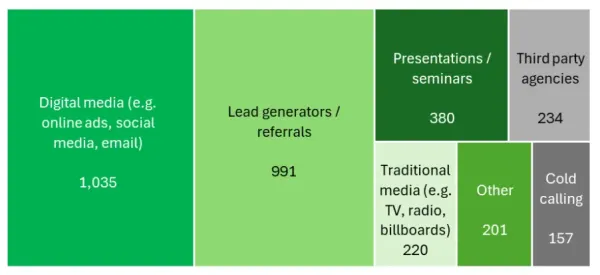
FAPs who selected “other” option for marketing and advertising commonly referred to mediums such as sponsorship activities, client functions and client referrals.

This chart highlights that digital media and lead generators/referrals are the most commonly used marketing strategies by providers.

Complaints during the return period

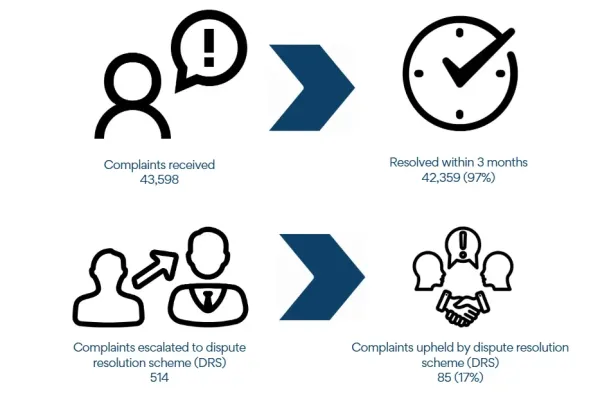
This chart highlights the efficiency and effectiveness of the complaint resolution process, showing a high percentage of complaints resolved quickly and a relatively low number escalated to and upheld by their respective Dispute Resolution Scheme.

The data of on complaints shows us that the sector is telling us most complaints are being resolved within 3 months, with only relatively low number escalated to and upheld by the dispute resolution scheme. We remind FAPs to ensure they are disclosing their DRS provider as part of their disclosure obligations under the Financial Markets Conduct Regulations 2014.

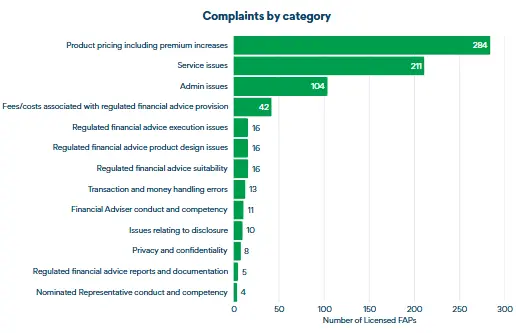
Complaints by category

This graph highlights the common themes for complaints. The most common complaints are related to product pricing and service issues.

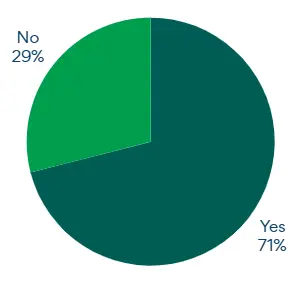
FAP outsourced any system or process during return period

The majority of FAPs have outsourced a system or a process relating to their market service licencee obligations during the return period.

Most FAPs outsource at least one system or process necessary to the financial advice service, which tells us the importance of conducting due diligence on providers you use, including regularly reviewing your arrangements.


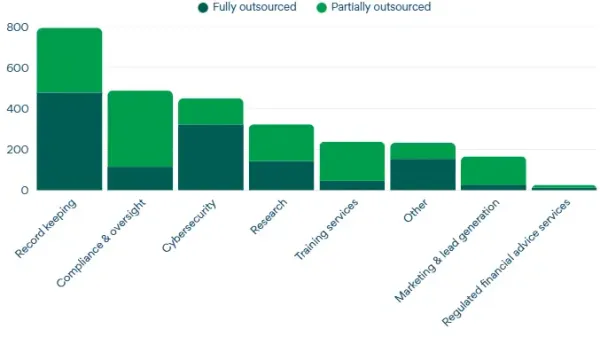
Outsourced system or process

Partially outsourced means that a system or process necessary to the financial advice service is both arranged in-house and also with an outsourced provider.

This graph highlights which FAP functions are more likely to be outsourced and to what extent, providing insights into trends in FAP operations management.

These Regulatory Returns contain a lot of information, if you have any questions please contact us

Read more about FAP regulatory returns

See the 2024 FAP Industry Snapshot for details